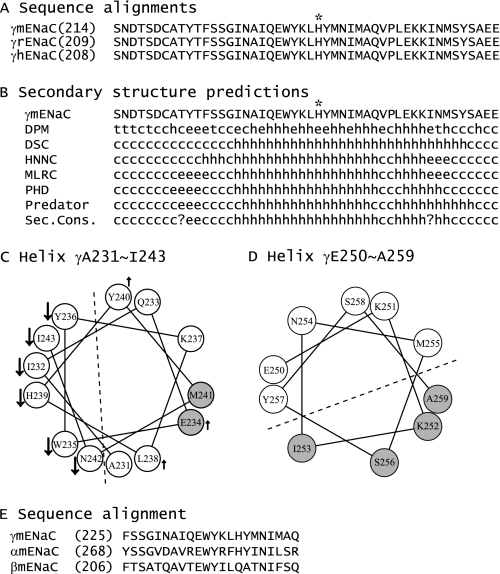
FIGURE 5.
Secondary structure predictions. A, sequence alignments of the segments corresponding to γSer214–Glu261 of mENaC. The alignments of γ subunits of mouse, rat, and human ENaCs were performed with Vector NTI 11.0 (Invitrogen), and only the regions of interest are shown. The full-length identities at the amino acid level are 97% between γmENaC and γrENaC and 86% between γmENaC or γrENaC and γhENaC. γHis239 is identified by an asterisk. B, secondary structure predictions of the mutated region of γmENaC. The predictions were performed with Network Protein Sequence Analysis (38). h, helical; e, extended; t, turn; and c, coiled. C and D, helical wheel projections. The helical wheels were generated with Membrane Protein Explorer (version 3.1) (39). Residues where mutations resulted in significant reductions or enhancements of Na+ self-inhibition, compared with WT, are identified by downward arrows and upward arrows, respectively. Gray spheres denote the residues where Cys substitutions led to significant changes in currents following MTSET application. A dashed line separates the two faces with distinct changes on the projected helical wheel. E, sequence alignments of the segments corresponding to the 22-residues tracts within γmENaC (γPhe225–γGln246), αmENaC, and βmENaC.

