FIGURE 6.
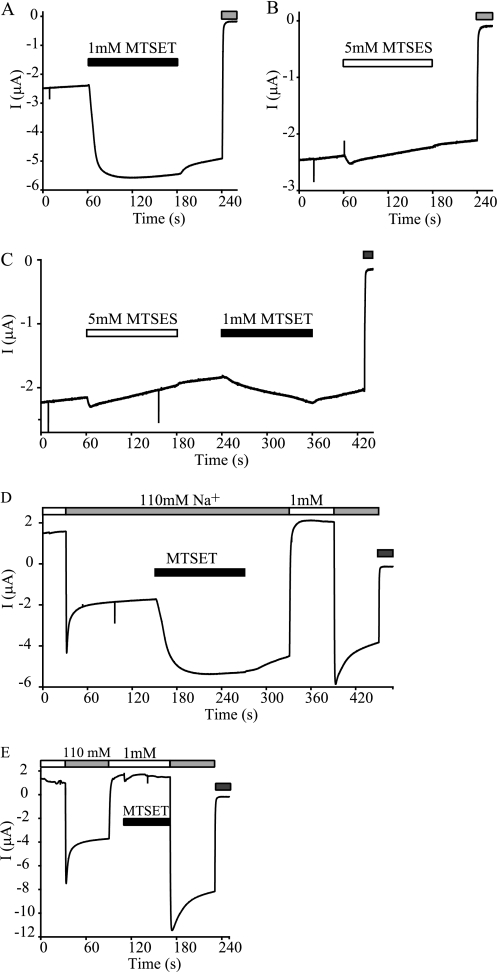
Effects of MTSET and MTSES on αβγE234C. Experiments were similar to those in Fig. 4. Recordings representative of at least five oocytes expressing αβγE234C are shown. The gray bars at the end of recording traces indicate the presence of 10 μm amiloride. A, typical response of αβγE234C to 1 mm MTSET. B, representative recording of αβγE234C current prior to, during (open bar), and after application of 5 mm MTSES. C, a recording showing the responses to 5 mm MTSES (open bar) and subsequent 1 mm MTSET (black bar). D, Na+ self-inhibition responses before and after 1 mm MTSET treatment. MTSET was applied in 110 mm Na+ bath solution (black bar). E, Na+ self-inhibition responses before and after 1 mm MTSET treatment. MTSET was applied in 1 mm Na+ bath solution (black bar).

