FIGURE 7.
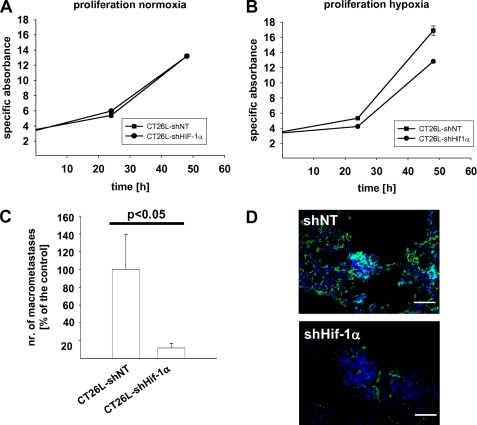
A and B, mean cell number in thousands per well ± S. E. (dots and bars), determined by alamarBlue proliferation assay of CT-26L-shNT and CT-26L-shHIF-1α cells under normoxic (A) or hypoxic conditions (1% (v/v) O2) (B). Hif-1α knockdown drastically affected tumor cell survival only under hypoxia. C, mean number (nr.) of lung metastases >0.2 mm ± S.E. (columns and bars) 20 days after intravenous inoculation of 1 × 10⁶ CT-26L-shNT or CT-26L-shHIF-1α cells, relative to the reference group CT-26L-shNT. CT26L-shNT, 100.0 ± 39.6%, n = 5 mice; CT-26L-shHIF-1α, 11.9 ± 5.2%, n = 7 mice. D, in situ zymography of lung metastases 20 days after intravenous inoculation of 1 × 10⁶ CT-26L-shNT or CT-26L-shHIF-1α cells. Counterstaining was done with DAPI (blue signal). Bars, 25 μm. Lack of Hif-1α led to a strong reduction of gelatinolytic activity (green signal) within metastases.

