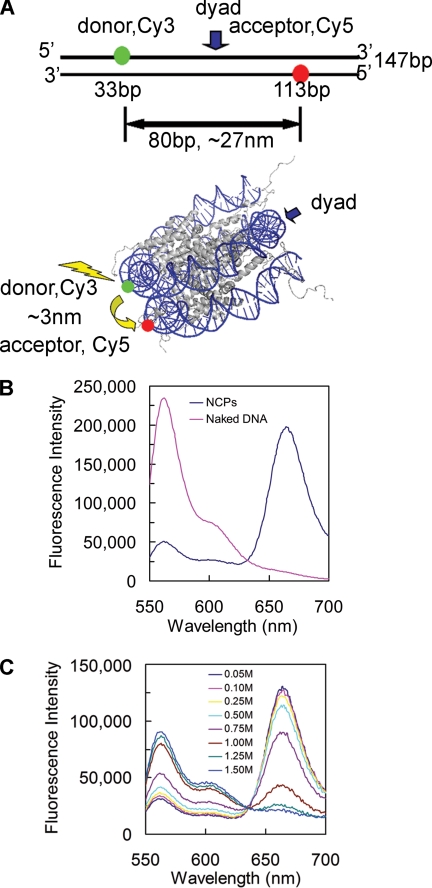
FIGURE 1.
FRET system to analyze the dynamic changes of nucleosomal DNA. A, locations of donor (Cy3) and acceptor (Cy5) on a 147-bp DNA. The DNA is the strongly positioned sequence 601. The upper panel shows the locations of Cy3 (green) and Cy5 (red) on the naked DNA. The two dyes are 80 bp apart, and the distance between the two dyes is ∼27 nm, which is far beyond the R0 (6 nm) for the Cy3-Cy5 pair. The lower panel is a schematic illustration of the locations of the dyes on the NCP structure. The distance between the two dyes is ∼3 nm, which falls into the R0, so that robust energy transfer could happen upon the excitation of the donor. The NCP structure was generated from the crystal structure with Protein Data Bank code 1KX5 (39). B, emission spectra of naked 601 DNA (pink) and 601 NCPs (blue) with excitation at 515 nm. C, salt-induced unwrapping of NCPs monitored by FRET. An appropriate volume of 5 m NaCl was added to the NCP sample, and the solution was allowed to equilibrate for 30 min at room temperature. Emission spectra were taken at different salt concentrations as shown. The data were normalized by the Cy5 signals excited at 615 nm.

