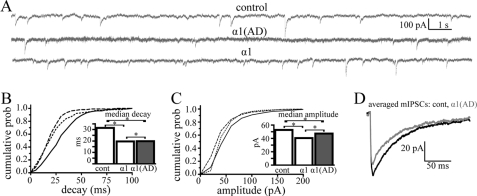
FIGURE 10.
Effect of the α1(AD) subunit on mIPSCs in cultured cortical neurons. In five separate experiments, we transfected DIV10 cultured cortical neurons with either control-IRES-ZsGreen1 (control), α1-IRES-ZsGreen1 (wild type, α1), or α1(AD)-IRES-ZsGreen1 (α1(AD)). On DIV17, we identified transfected neurons by ZsGreen1 fluorescence and recorded >100 mIPSCs events from each. A, we showed sample mIPSC current traces. Transfection of both the α1 and α1(AD) subunit altered mIPSC current kinetics (B and D). B, we plotted a histogram that depicts the mIPSC decay time constants on the abscissa and the cumulative probability (prob) of an mIPSC having that decay time on the ordinate. Neurons transfected with control vector (solid line) had the biggest decay time constants followed by those transfected with α1(AD) (dotted line) and α1 (dashed line, p < 0.001). In the inset, we plotted the median mIPSC decay times. C, we plotted a histogram depicting mIPSC peak amplitudes on the abscissa and cumulative probability of a mIPSC having that peak amplitude on the ordinate. Neurons transfected with control subunit possessed larger mIPSC amplitudes than α1(AD)-transfected neurons, which possessed larger amplitudes than those transfected with α1 subunit (p < 0.001). The median mIPSC amplitudes are plotted in the inset. D, we displayed averaged (>100 events) mIPSC traces for wild type (black) and α1(AD)-transfected neurons (gray) demonstrating both the accelerated decay and reduced mIPSC amplitudes in neurons transfected with the α1(AD) subunit. *, p < 0.05.

