FIGURE 4.
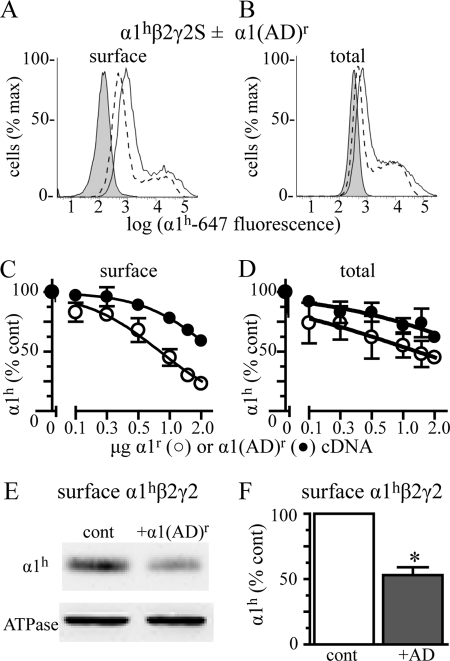
Effect of α1(AD) subunit expression on surface and total α1β2γ2 expression. We transfected HEK293T cells with empty vector (negative control, shaded histograms) or 0.250 μg of β2 and γ2S subunits and 0.125 μg α1h subunit cDNA (hemizygous) and with varying masses (0–2 μg) of α1r or α1(AD)r cDNA. We quantified the surface (A and C) and total (B and D) α1h subunit expression using flow cytometry with anti-α1h subunit antibodies. A and B, we depicted hemizygous fluorescence as a solid line and hemizygous + 2 μg of α1(AD)r fluorescence as a dashed line. C and D, we plotted α1(AD)h (●) and α1h (○) subunit fluorescence normalized to that of hemizygous subunit fluorescence versus the masses of α1(AD)h or α1h cDNA that was transfected. Increasing the masses of α1(AD)r subunit cDNA reduced surface and total α1h subunit expression. We also determined the effect 2 μg of α1(AD)r subunit cDNA co-transfection on surface α1hβ2γ2 receptor expression using biotinylation assays with Western blot (E and F). We stained the Western blots with the anti-α1h subunit antibody and quantified surface α1h subunit relative to that of the Na+/K+-ATPase α subunit (loading control (cont)). The addition of 2 μg of α1(AD)r subunit cDNA (+AD) reduced surface expression of α1hβ2γ2 receptors by 46 ± 6% (n = 4; p = 0.005). The α1(AD)r subunit did not alter the surface expression of the endogenous ATPase α subunit (97 ± 10%, n = 5).

