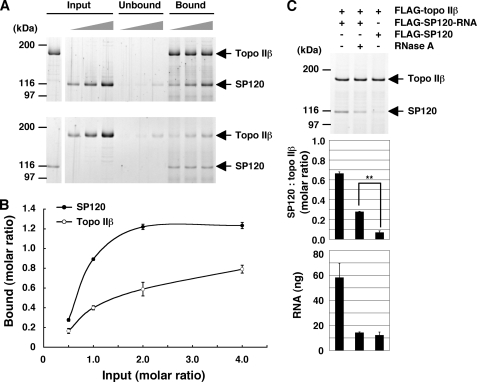
FIGURE 5.
The topo IIβ-SP120-RNA complex: Stoichiometry and resistance to RNase. A, tag-purified FLAG-topo IIβ and FLAG-SP120 with tightly-bound RNA were mixed at the molar ratio of 0.5, 1.0, 2.0, keeping one of the proteins constant (shown in the leftmost lane of Input). After incubation, the mixture was subjected to immunoprecipitation with anti-peptide antibodies to the unvaried counterpart: topo IIβ (upper panel) and SP120 (lower panel). The proteins on beads (Bound) and in solution (Unbound) were separated by SDS-PAGE and visualized by SYPRO Ruby staining. B, band densities for topo IIβ and SP120 in the complex were quantified by densitometry and plotted along the ordinate as molar ratios of the varied protein to the fixed protein on beads, assuming topo IIβ as monomeric form. Values shown are average and standard deviation from three independent experiments. C, RNase resistance assay. Purified FLAG-topo IIβ was mixed with equimolar amounts of tag-purified SP120 (FLAG-SP120-RNA). The mixture was treated (+) or untreated (−) with RNase and then immunoprecipitated with anti-topo IIβ antibody. As a control, SP120 that had been pretreated with RNase in high-salt extract was used (FLAG-SP120). Protein bands were visualized by SYPRO Ruby (top panel) and quantified by densitometry (middle panel). Note that the difference between RNase (+) and control is statistically significant by Student's t test (p < 0.01). RNA was purified from the complex on beads and quantified by using RiboGreen. RNA per 100 ng of topo IIβ was graphed (bottom panel). Values shown in graphs are average and standard deviation from three independent experiments.

