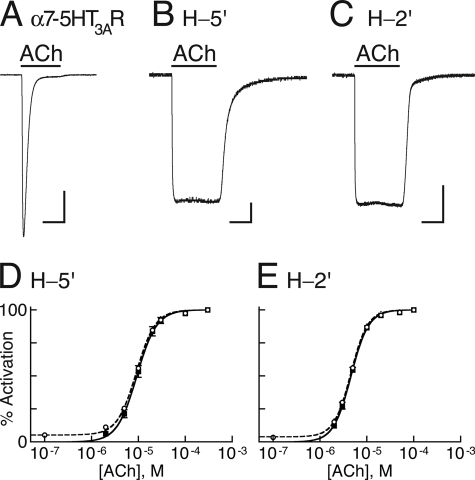
FIGURE 3.
Channel activity and allosteric modeling. A–C, representative inward currents measured at −80 mV and room temperature in Xenopus oocytes expressing the indicated chimeras, as a response to saturating concentrations of ACh (300 μm). In each panel, the horizontal bar at the bottom corresponds to 3 s, and the vertical bar corresponds to 0.5 μA. D and E, dose-response curves (continuous black lines) for the indicated chimeras fitted by the Hill equation (Equation 3) to data points obtained from ACh-elicited steady-state currents (black squares). The dashed curves were fitted to data points that include the ACh-elicited currents plus the Zn2+-inhibited leak currents (open circles). Fitting of the dashed curves was performed by using a two-state allosteric model (Equation 4 in “Experimental Procedures”) with n = 5 binding sites, microscopic ACh dissociation constants for the resting (KDr) and active (KDa) states as provided in Table 2, and equilibrium constants L = 18 and L = 28 for H-5′ and H-2′, respectively. L values were determined as explained in the legend to supplemental Fig. S2, E–H.

