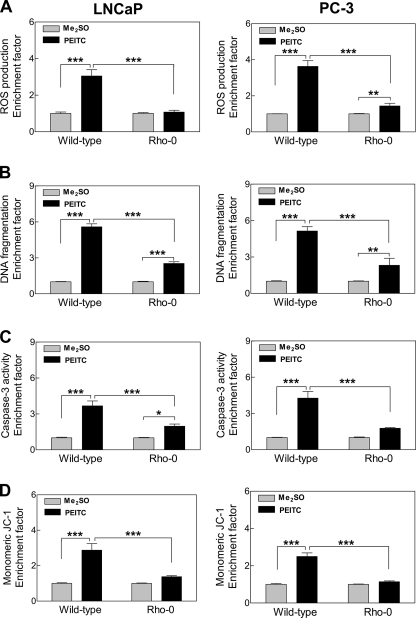
FIGURE 8.
Rho-0 variants of LNCaP and PC-3 cells were resistant to apoptosis induction by PEITC. A, ROS production; B, DNA fragmentation; C, caspase-3 activation; and D, monomeric JC-1 associated green fluorescence (a measure of mitochondrial membrane potential collapse) in wild-type LNCaP and PC-3 cells and their respective Rho-0 variants following a 4-h treatment (A and D) or 24-h treatment (B and C) with Me2SO or 5 μm PEITC. Results shown are mean ± S.E. Total sample size is n = 6 per group. As described under “Statistical Methods,” S.E. bars are estimated from the mixed effects ANOVA (*, p < 0.05, **, p < 0.01, and ***, p < 0.001).

