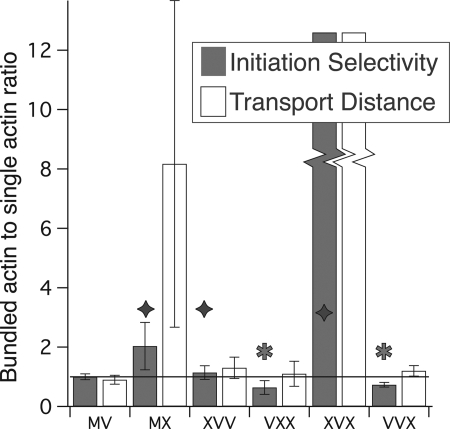
FIGURE 3.
Myosin X head domain is more successful at run initiation on bundled actin. Two dimensionless ratios are displayed. Gray bars represent the initiation selectivity for each processive construct. These initiation selectivities measure the relative rates of landing (with detectable movement) on bundles versus actin filaments and are given as [Rb·exp(0.2 μm/λb)]/[3.5·Rs·exp(0.2 μm/λs)] Here, λ is the run length, R is the measured initiation rate, and subscripts s and b denote single filaments and bundles, respectively. Initiation rates, R, are determined at identical motor concentrations and are calculated as the number of observed events per μm track length per second. The exponential factors correct for missed events that fall below our 0.2-μm detection threshold. We find that myosin V is 3.5 times more likely to initiate runs on the same length of bundles as on single actin. Therefore, we applied a factor of 3.5 in the denominator to set myosin V as a reference motor with an initiation selectivity of 1. The two motors with the largest initiation selectivities, or preference for bundled actin, are wild type MX and XVX. However, note that the initiation selectivity for XVX is large and indeterminate as there were only two events observed on actin filaments. Every construct with a myosin X head (diamonds) is more successful than wild type myosin V at run initiation on bundled actin, whereas myosin V head constructs (stars) are more successful on actin filaments. In the transport distance ratios (open bars), we show the relative distance traveled by each motor, given equal lengths of each type of track. To obtain these, we multiply the initiation selectivities by the run length ratio (λb/λs). Note that the wild type myosin X has the highest transport distance ratio, excluding the indeterminate XVX. Error bars indicate 95% confidence intervals.

