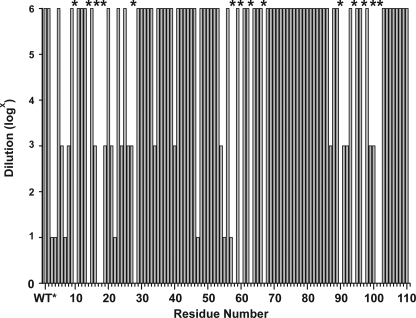
FIGURE 1.
Growth phenotypes of cells expressing EmrE single cysteine mutants. Saturated cultures of each mutant were diluted by a factor of 106, 103, and 10 and spotted on agar plates containing ethidium bromide as described under “Experimental Procedures.” The height of the bar indicates the maximal dilution at which cell growth was observed. * indicates mutants that did not support a resistance phenotype.

