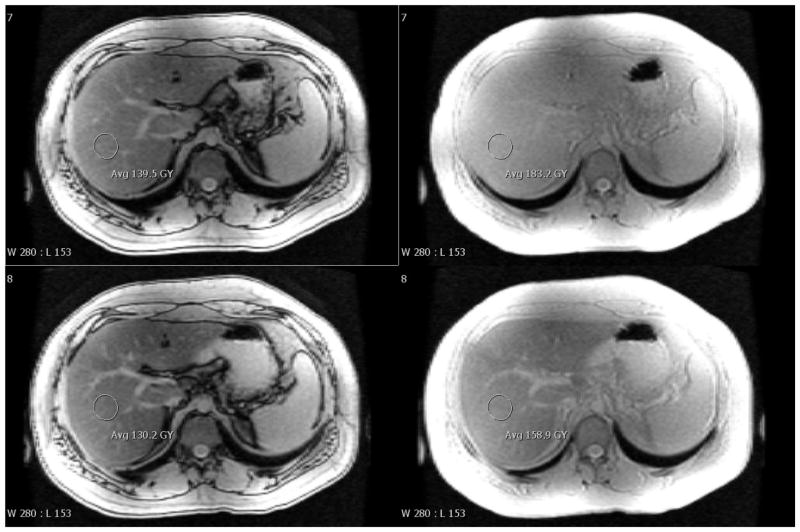
Figure 1.
Representative gradient echo images of the liver at 3.0T using TR 200 ms and flip angle 10°. (A) shows pre-SPIO at TE 1.15 and 2.3 ms and (B) shows 1 hour post-SPIO at the same TEs. Annotations give the mean signal intensity inside an ROI and the window/level settings are identical. The calculated dual echo FFs are 11.9% and 9.0% for the pre- and post-SPIO images. The corresponding R2*s are 0.047 and 0.149 ms−1 and FFs are 16.9 and 17.8% (monoexponential). The gold-standard spectroscopy FF (pre-SPIO) is 17.2%.

