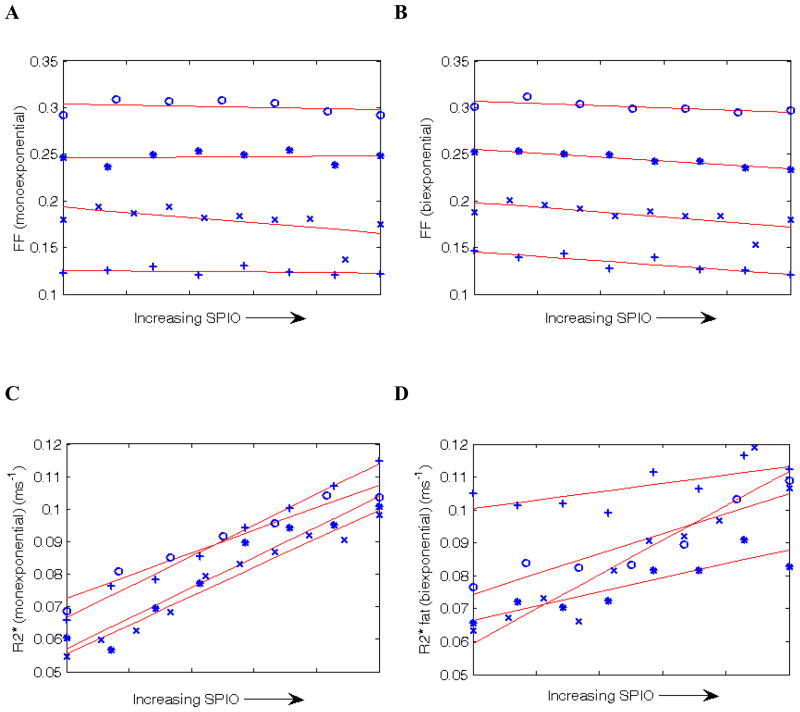
Figure 3.
(A) Plot of FF estimated by the monoexponential model as SPIO was administered. Of the 4 patients, 3 show a small negative trend and 1 shows a small positive trend. (B) shows FF estimated by the biexponential model. In all 4 patients the trend is negative and is more negative than the corresponding data in B. (C) and (D) show the corresponding changes in the monoexponential R2* and the biexponential fat R2*. These both increase with [SPIO], as expected. (Note the biexponential water R2* is almost identical to the monoexponential R2* and is not shown.)

