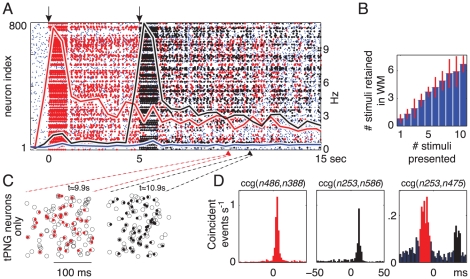
Figure 5. Multiple overlapping polychronous neuronal groups in working memory.
(A) Spike raster and firing rate plots as in Figure 4. The first, red target PNG (tPNG) is activated at time 0 seconds; the second, black tPNG at time 5 seconds. The two PNGs co-exist in WM even though they share more than 25% or their neurons, which fire with different polychronous patterns. (B) Capacity tested by multiple items in WM. (C) Magnified plot of the spike rasters (red/black dots) of partial activation of the two tPNGs — red (left) and the black (right). Notation as in Figure 4B. (D) Red, left: cross-correlograms of two neurons that are part of the red but not the black PNG, when only the red PNG is in WM ( sec). Black, middle: cross-correlograms of neurons that are part of the black but not the red PNG, when only the black PNG is in WM (spike raster not shown). Right: cross-correlograms of two neurons, one from each target PNG, when both PNGs are in WM (
 sec).
sec).

