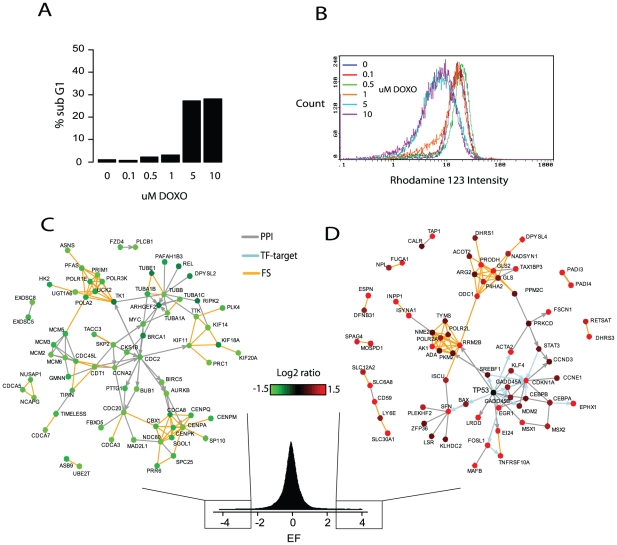
Figure 2. NetWalk analysis of low and high-dose doxorubicin response in MCF7 cells.
A) Apoptosis levels in MCF7 cells after 24 hours of stimulation with indicated doses of doxorubicin as measured by FACS analysis of DNA content (see Methods). B) FACS analysis of viable cells as indicated by loss of Rhodamine 123 staining(see Methods). C–D) Plots of interactions with lowest(B) and highest (C) EF values in samples treated with 1 µM doxorubicin for 24 hours relative to control. Nodes are colored according to their gene expression change relative to control according to the color key. Edge coloring reflects type of interaction, PPI: protein-protein interaction, TF-target: gene regulation, FS: functional similarity. The distribution plot of all EF values is shows at the bottom.

