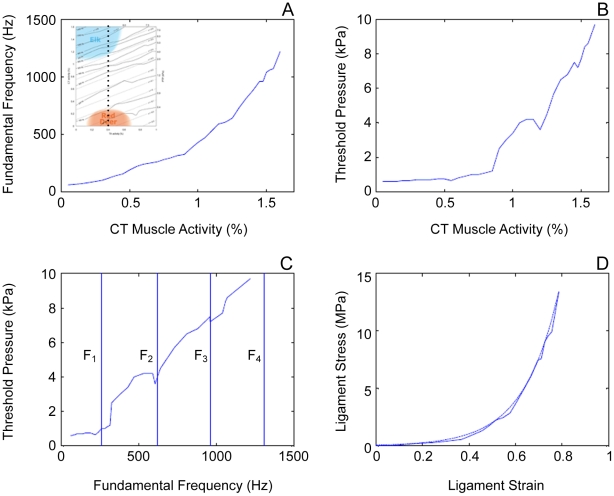
Figure 8. Results of taking a path through the MAP.
Taking a path through the MAP of Figure 5 along an imaginary line at aTA = 0.4 (indicated by a dotted line in the inset in A), incrementing aCT in steps of 0.05 from bottom to top leads to characteristic changes of acoustic parameters. A: fundamental frequency versus aCT, B: phonation threshold pressure versus aCT, C: phonation threshold pressure versus fundamental frequency, D: ligament stress plotted against strain.

