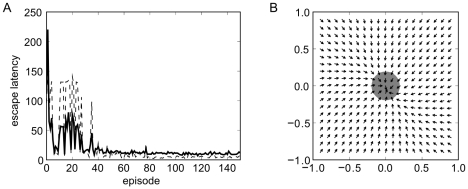
Figure 5. Performance of the learning system in the Morris water maze task with Q-learning.
A) Mean escape latency (in simulation time steps) as a function of learning episodes for 10 independent sets of episodes (full thick line). The thin dashed line indicates the standard deviation. B) The navigation map of the system after training. The vectors indicate the movement directions the system would most likely choose at the given positions in the water maze. An episode ended successfully when the center of the fish reached the area indicated by the gray disk.

