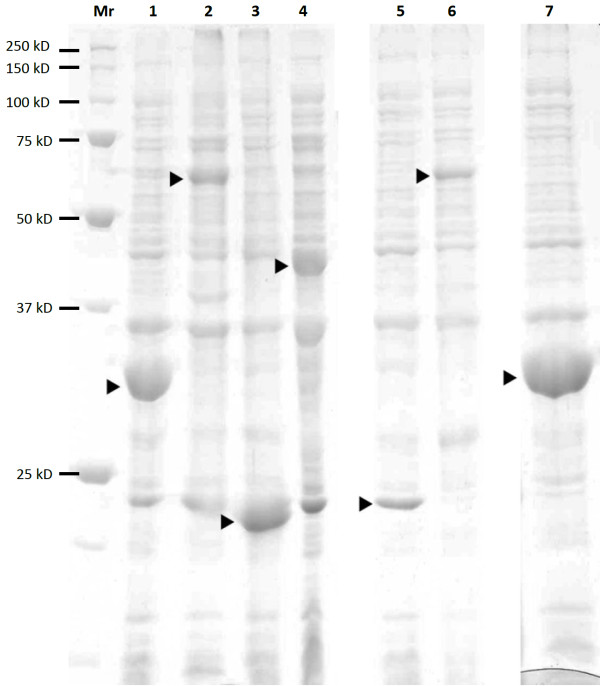
Figure 4.
High expression levels are reached with most of the vectors. The cell pellets from expression cultures were extracted with SDS-gel sample buffer and run on 12% SDS_PAGE. From left to right: Mr markers; 1, PSTCm1-EB1; 2, PSPCm2-VP3; 3, PSTCm8-CapGly; 4, PSTCm8-TTL; 5, PSTCm11-CapGly; 6, PSKn1-Clip170; 7, NSkn1-EB1. The desired expression product is represented by the strongest band in the corresponding lane with the total cell extract. Only the vector PSAp1 gave less vigorous expression (not shown).

