
Figure 4.
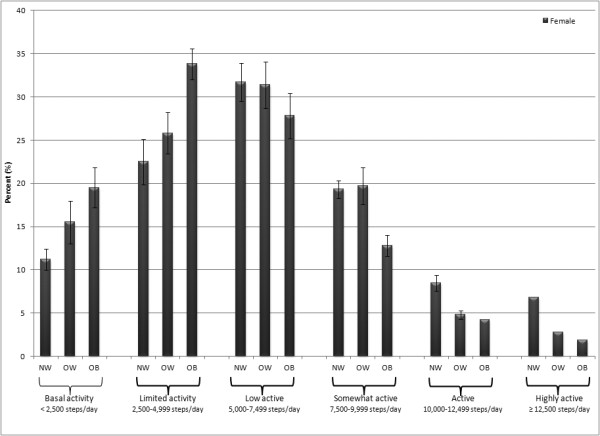
Percent of females classified by step-defined activity levels considering BMI category (normal weight = NW, overweight = OW, obese = OB). Bars depict SE.
Official websites use .gov
A
.gov website belongs to an official
government organization in the United States.
Secure .gov websites use HTTPS
A lock (
) or https:// means you've safely
connected to the .gov website. Share sensitive
information only on official, secure websites.
Percent of females classified by step-defined activity levels considering BMI category (normal weight = NW, overweight = OW, obese = OB). Bars depict SE.