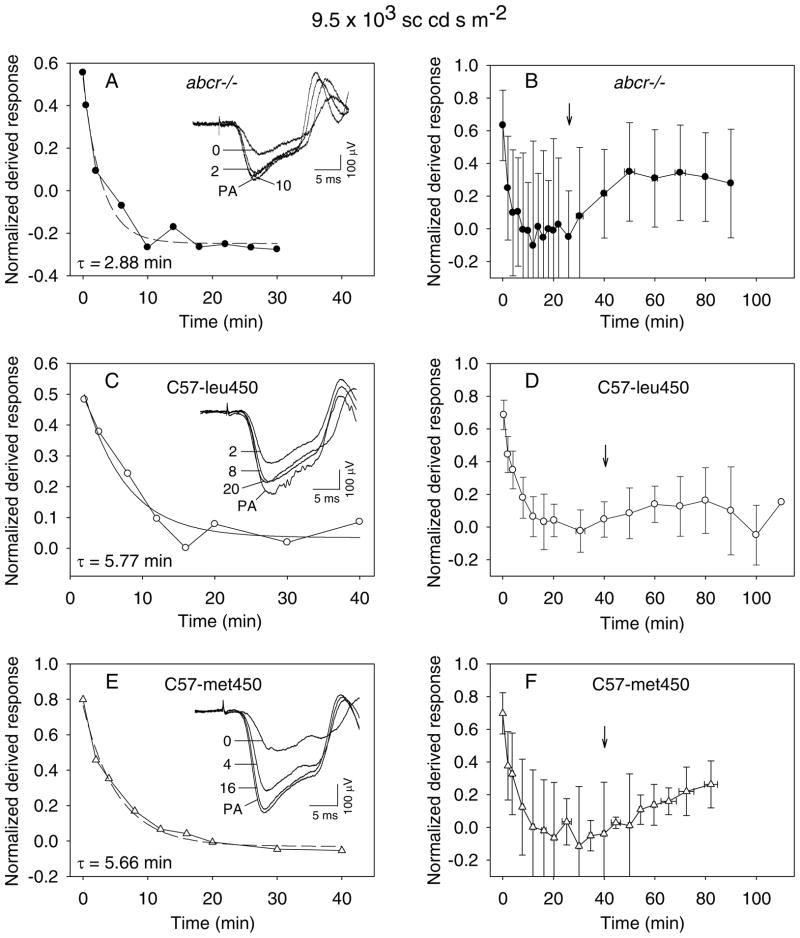
Fig. 3.
Recovery following ~3% bleach. A, C and E: Recovery data obtained in single experiments on abcr−/−, C57-leu450 and C57-met450 mice, respectively. Insets: Representative responses to the probe flash. Response PA: dark-adapted probe-alone response. Dashed curve: simple exponential function fitted to the data obtained from the time of conclusion of the bleaching light (time zero to through the apparent plateau of recovery (see text). B, D and F: Aggregate data obtained in groups of experiments on abcr−/−, C57-leu450 and C57-met450 mice respectively. In cases where data obtained at different values of tprobe were binned, the abscissa value and horizontal error bar of the illustrated data point represents the mean ± SD of the binned tprobe values. The vertical arrow in each panel identifies the conclusion of the period over which data were analyzed in relation to the exponential function.

