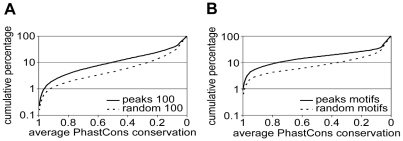
Figure 2. Conservation of p63 binding sites and motifs in vertebrates.
The percentage of p63 binding sites (y-axis) is plotted against decreasing cut-off values of the PhastCons Conservation Score (PCCS) (x-axis). A point on the line indicates the percentage of binding sites with that particular PCCS or higher. (A) Average PCS of 100-nucleotide regions centered at the summit of 11,425 p63 binding peaks (peaks 100) and that of 100,000 100nt regions randomly chosen from the whole genome (random 100). (B) Average PCCS of 10,659 10-nt p63 motifs detected by p63scan in the 11,425 p63 binding peaks (peaks motifs) and of the 7,600 motifs detected in 100,000 random genomic regions (random motifs).

