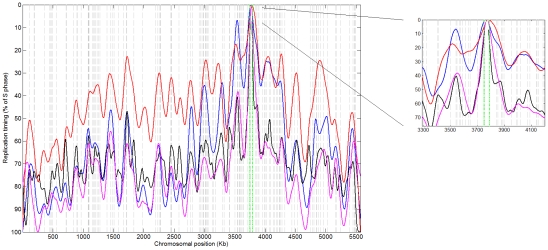
Figure 4. Replication timing profile of S. pombe chromosome 1.
Replication timing microarray data for chromosome 1 from [35] (blue), [34] (red- time course experiment; black- HU experiment), and [36] (magenta) show early replication at CEN1. Green lines: centromere location; dashed grey lines: ORC binding sites that also incorporated BrdU [38].

