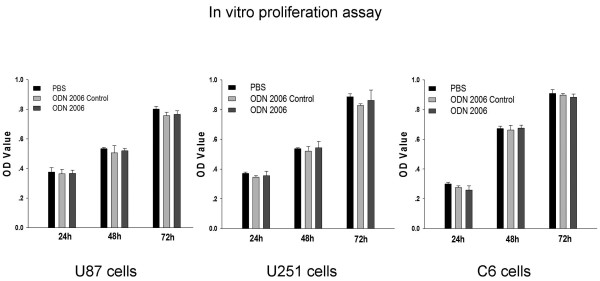
Figure 3.
Proliferation of glioma cell lines in response to CpG ODN(ODN 2006). Human U87 glioma cell line, human U251 glioma cell line, and rat C6 glioma cell line were incubated with CpG ODN(10 uM), CpG ODN Control(10 uM) or same volume of PBS. The analysis was performed in triplicate and cell growth was measured at 24, 48, 72 hours with an ELISA reader at 490 nm, data was represented as OD value. Bars refer to the standard error of the mean value. Comparison between groups was made by using student's t test, P ≤ 0.05 was defined as significant.

