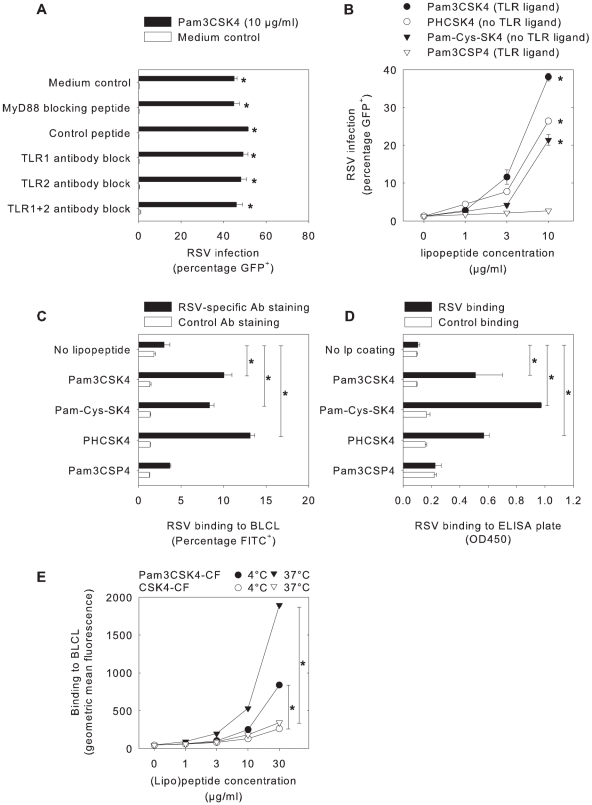
Figure 3. The effect of Pam3CSK4 on B-LCL is independent of TLR signaling, but mediated by enhanced virus binding.
(A) B-LCL were pre-incubated with the myeloid differentiating factor 88 (MyD88) homodimerization inhibitory peptide, a control peptide, or polyclonal blocking antibodies to TLR1, TLR2 and/or TLR4, followed by Pam3CSK4 incubation (10 µg/ml, 30 minutes, 37°C) and subsequent infection with rgRSV. In all conditions Pam3CSK4 treatment resulted in enhancement of rgRSV infection (p<0.05). (B) B-LCL were incubated with different lipopeptides (for molecular structures see Figure S1) with or without TLR signaling capacities. In addition to TLR agonist Pam3CSK4 two non-TLR2 activating lipopeptides Pam-Cys-SK4 and PHCSK4 enhanced rgRSV infection, whereas the TLR agonist Pam3CSP4 did not (p<0.05 with Dunnett's correction for multiple comparisons for Pam3CSK4, Pam-Cys-SK4, and PHCSK4 concentrations 3 and 10 µg/ml). (C) RSV binding to B-LCL was determined by pre-incubating rgRSV with the different lipopeptides, followed by assessment of binding to cells. RSV binding was quantified by staining with FITC-labeled antibodies to RSV or to influenza-B as a control. Addition of the lipopeptides Pam3CSK4, Pam-Cys-SK4 and PHCSK4 but not Pam3CSP4 significantly increased binding of RSV to the cells (p<0.05 using Dunnett's correction for multiple testing). (D) Direct RSV binding to lipopeptides was examined in an ELISA format. Lipopeptides were coated on high-binding ELISA plates and incubated with RSV, or with MV strain Edmonston as a control. RSV binding was measured using an RSV-specific monoclonal antibody, followed by detection using a goat-anti-mouse peroxidase and TMB as a substrate. Coating with Pam3CSK4, Pam-Cys-SK4 and PHCSK4 but not with Pam3CSP4 resulted in increased RSV binding (p<0.05 compared with Dunnett's correction). Data are shown as extinctions at 450 nm (means ± SD of duplicates). (E) B-LCL were incubated with Pam3CSK4-CF or CSK4-CF at 4°C or 37°C to measure direct (lipo)peptide binding to the cells. At both temperatures Pam3CSK4-CF showed significantly stronger binding than CSK4-CF (p<0.01 with Bonferroni correction at concentrations 10 and 30 µ/ml). In panels A-C results are shown as percentages GFP- or FITC-positive cells (means ± SD of duplicates) and in Panel E data are shown as geometric mean fluorescence (means ± SD of triplicates). Representative examples of at least three experiments are shown.

