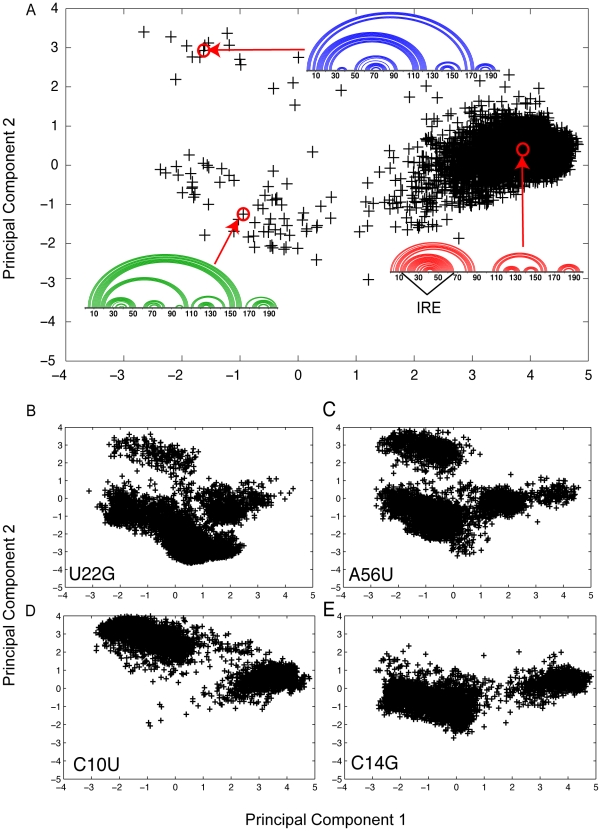
Figure 3. Structural analysis using Boltzmann sampling and principal cponent analysis of FTL 5′ UTR and four Hyperferritinemia cataract syndrome–associated mutations [39].
(A) Boltzmann sampling and principal component decomposition of 5000 alternative structures of the FTL 5′ non-diseased UTR. Each cross in the diagram represents one of the 5000 structures projected onto the first two principal components [40]. We use linear (or arc) diagrams to illustrate representative structures in the principal component space. In this case, three main clusters are observed, with the right, middle quadrant (red representative structure) being most highly populated for the WT sequence. Structures within this highly populated cluster all contain an IRE element (indicated in the figure), which has been shown to be critical in regulating FTL [39]. (B) Effect of the U22G mutation on the RNA structural ensemble involves populating both of the alternative RNA conformations. (C) A similar redistribution occurs with the A56U mutation. (D) Only the top, left hand cluster is populated with the disease-associated C10U mutation. (E) The C14G populated the lower, left hand quadrant, which also does not form the regulatory IRE.

