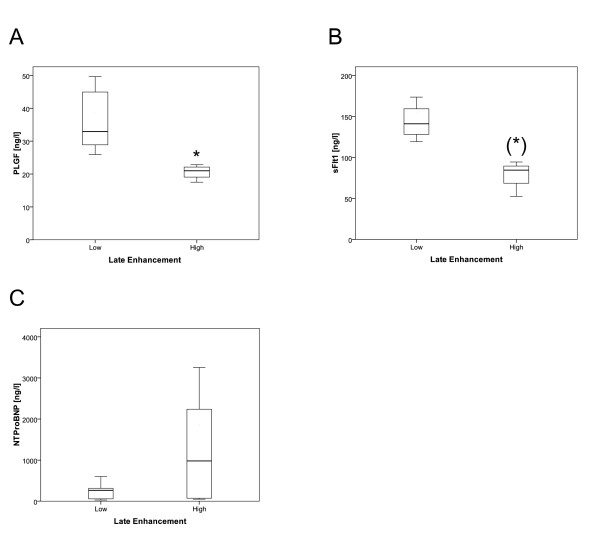
Figure 5.
The differences in serological markers of CMP are shown as box plots. (A) PLGF was significantly decreased in the high LGE group (p = 0.016). (B) sFLT1 showed a strong trend to be decreased in the high LGE group (p = 0.057) (C) NT-proBNP was not significantly different between the two groups, but very high values ( > 1000 ng/L) could only be found in the high LGE group, * p < 0.05

