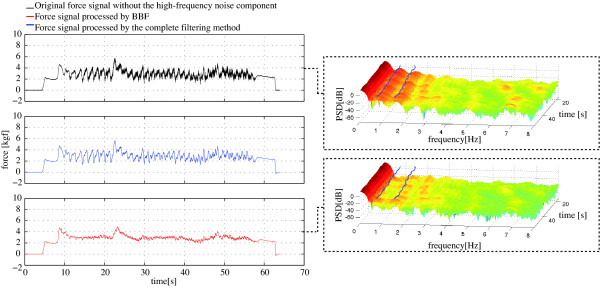
Figure 10.
On the left, representation of force data for the y axis of the left sensor in one experiment in three stages: raw force data (top), data after the BBF (middle) and final output (bottom). On the right, the spectrogram of the filtering input (top) and output (bottom) are presented along with the continuous line marking the continuous cadence estimation by means of WFLC. Important reductions in PSD of high frequencies and in both cadence harmonics are observed.

