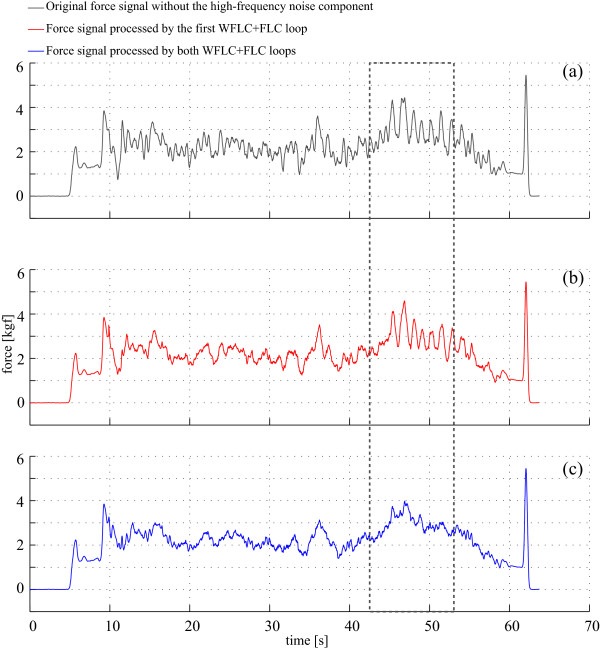
Figure 8.
The top graph (in black) shows the force data after the canceling of the high-frequency components for the tuning of the FLC algorithm. Middle graph shows the signal (in red) after the FLC filtering taking into account only the cadence frequency (one harmonic). Finally, the bottom graph (in blue) shows the filter output signal processed with the final FLC filter. The dashed box indicates the instants in which asymmetrical support is forced through a right turn performed with the walker.

