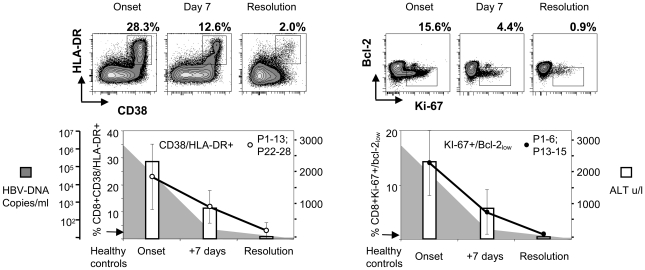
Figure 1. Activated and proliferating CD8 T cells during acute hepatitis B infection.
Longitudinal CD38/HLA-DR (left) and Ki-67/Bcl-2 (right) expression on total CD8 T cells in patients with acute HBV infection (n = 20) is shown. Ki-67/Bcl-2 expression was done in 9 out of 20 patients. FACS contour plots were gated on CD3/CD8 positive cells. Percentages of double positive cells are shown. The arrow indicates the level of activation/proliferation found in healthy controls (the average of 5). White bars indicate the mean serum ALT levels, shaded area shows the mean serum HBV DNA of the patients tested.

