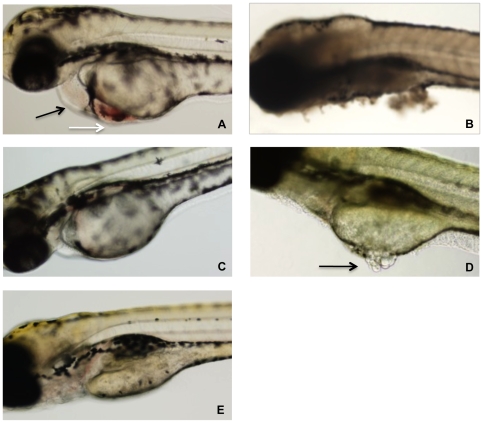
Figure 2. Representative photographs of zebrafish after 24 h exposure to TcdB.
(A) Zebrafish after exposure to 10 nM TcdBHIST. Cardiac damage is evident by pericardial edema (black arrow) and blood accumulation (white arrow). (B) Exposure to 10 nM TcdBHV causes tissue necrosis and death of the zebrafish. (C) Zebrafish treated with 1 nM TcdBHIST appear normal, with little to no edema. (D) Zebrafish after exposure to 1 nM TcdBHV. Arrow indicates damage to the yolk sac, visualized by tissue discoloration and necrosis. (E) Untreated control.

