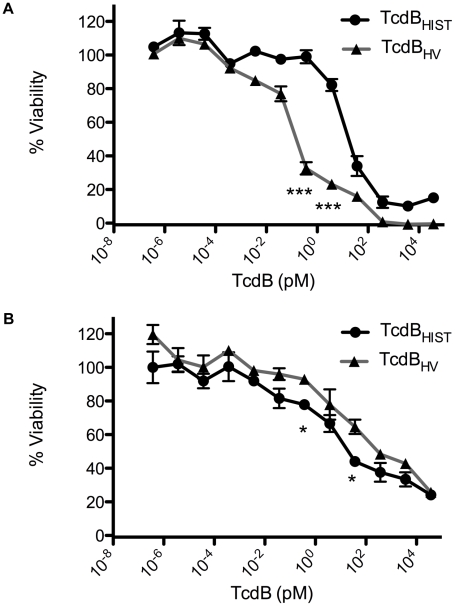
Figure 3. Comparative dose response of TcdBHIST and TcdBHV.
CHO or HL-1 cells were exposed to TcdB for 24 h and cell viability was determined by WST-8 staining. (A) TcdBHIST (black) and TcdBHV (gray) intoxication of CHO cells. (B) TcdBHIST (black) and TcdBHV (gray) intoxication of HL-1 cardiomyocyte cells. The error bars represent the standard deviation from the mean of three samples. * p<0.05, *** p<0.001.

