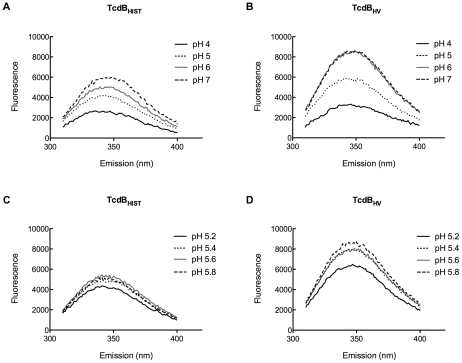
Figure 8. Tryptophan emission of TcdBHIST and TcdBHV at acidic and neutral pH.
The fluorescent spectrum of each sample is shown and labeled; each spectrum represents the experimental sample minus background fluorescence of buffer alone. Panels (A) and (B) show tryptophan emission of TcdBHIST and TcdBHV from pH 4.0 to pH 7.0 while panels (C) and (D) highlight the changes in tryptophan fluorescence between pH 5.0 and pH 6.0.

