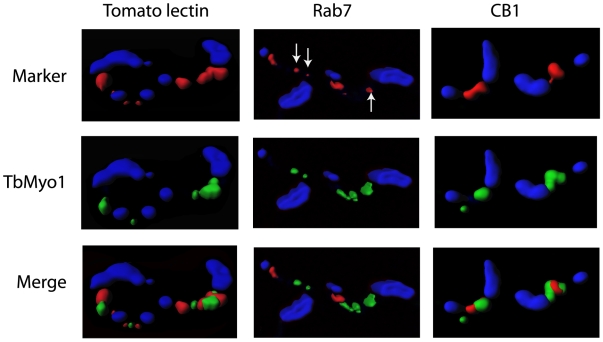
Figure 5. Colocalization of TbMyo1 with elements of the endocytic pathway in bloodstream forms.
Purified T. brucei bloodstream forms were processed for immunofluorescence as described in the methods section. The cells were probed with affinity purified TbMyo1 antibody (green) and colocalizations were performed with Texas red labelled tomato lectin, rat anti-Rab 7 or mouse anti-CB1 (red). The cells were incubated with lectin for 1 min at 37°C before being diluted 10-fold into the ice-cold buffer, washed and then processed for immunofluorescence. The anti-Rab7 and anti-CB1 antibodies were detected using the relevant Alexa 568 labelled secondary antibody (red). In all cases the position of the nucleus and kinetoplast was revealed by DAPI staining (blue). The cells were examined using an Olympus Fluoview 1000 confocal microscope. The images were captured using an “UPLSAPO 60X O NA:1.35” objective, optically sectioned at 0.35 ųm/slice and the combined Z-stack images were reconstructed and iso-surface rendered using Imaris (v6.4.2) imaging software. The upper panels present the location of the markers, the middle panels represent the location of TbMyo1 and the lower panels represent the merge of both signals. Arrows indicate small Rab7 compartments where there appeared to be full overlap with TbMyo1 signal.

