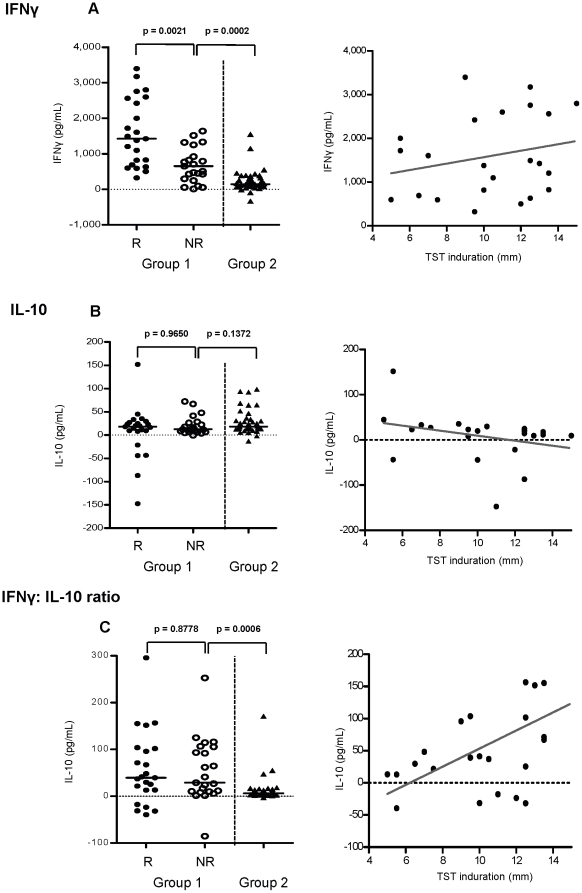
Figure 3. Relationship between TST and cytokine production.
At 4½ months of age, whole blood was incubated with PPD for 5 days. (A) IFNγ and (B) IL-10 cytokine production and (C) the ratio of IFNγ: IL-10 was measured in the supernatants of the PPD cultures (left). Unstimulated control was subtracted from the PPD stimulated values, black bar represents the median value. A Mann-Whitney U test at 5% significance was applied to compare the cytokine production between groups (left graphs). Correlation between the TST induration of the responders and IFNγ, IL-10 and the ratio of IFNγ: IL-10 was calculated using Spearmans correlation coefficient at 5% significance (right graphs), dark grey line represents line of regression. R = responder n = 23, NR = non responder n = 22, unvaccinated n = 38.

