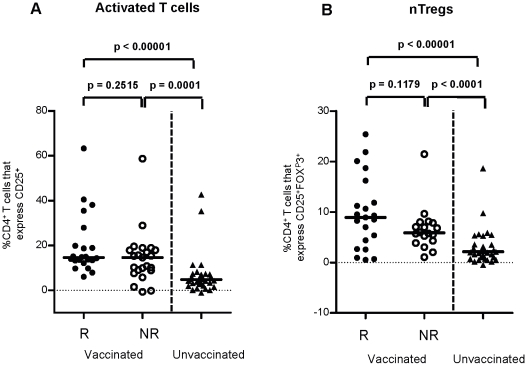
Figure 4. Relationship between TST and T cell phenotype in response to PPD.
At 4½ months of age, whole blood was cultured with PPD for 5 days. (A) frequencies of activated T cells (CD4+CD25+) and (B) naturally occurring Tregs (CD4+CD25+FOXP3+) were measured with respect to TST reactivity. Unstimulated control was subtracted from the PPD stimulated values, black bar represents the median value. Comparisons between responders (R), non responders (NR) and unvaccinated individuals were calculated using a Mann-Whitney U test at 5% significance. R = responder n = 22, NR = non responder n = 21, unvaccinated n = 34.

