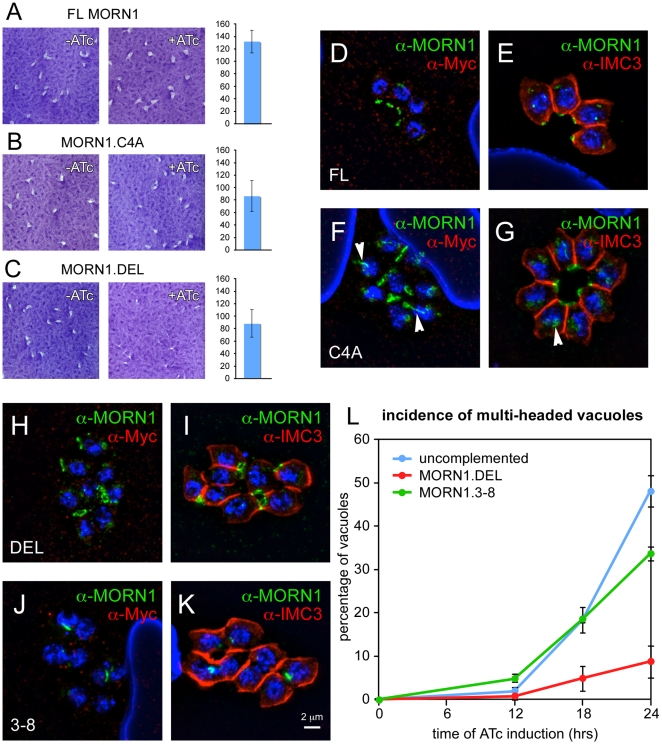
Figure 7. Complementation of the MORN1-KO parasites with various MORN1 constructs.
(A–C) Plaque assays of MORN1-KO parasites complemented with full length (FL) MORN1, full length MORN1 with a Cys 4 to Ala point mutation (MORN1.C4A) to disrupt a predicted palmitoylation site and MORN1 wherein the linker region was removed (MORN1.DEL). The graphs on the right display the number of plaques relative to the control without ATc (percentage). Average of three independent experiments; error bars denote standard deviation. (D–K) MORN1-KO parasites complemented with full-length MORN1 (D,E), MORN1.C4A (F,G), MORN1.DEL (H,I) or MORN1.3–8 (J,K) stained with α-Myc and α-MORN1 (D,F,H,J) or α-MORN1 with α-IMC3 (E,G,I,K). Arrowheads in (F,G) point out the fiber emanating from the centrocone in some of the MORN1.C4A complemented parasites. (L). Quantification of the incidence of double-headed parasites in the MORN1 null phenotype (uncomplemented), the MORN1-KO complemented with the MORN1.DEL or the MORN1.3–8 construct plotted as a function of time of ATc induction. At least 150 vacuoles were scored at each condition. Average of three independent experiments is shown; error bars denote standard deviation. Single channel fluorescence figures for panels (D–K) are available in Supplementary Figure S5.

