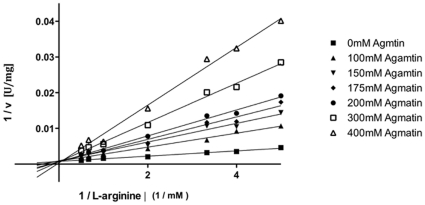
Figure 4. Inhibition study of OcDH by using agmatine.
A Lineweaver-Burk plot is shown for the activity of OcDH at fixed L-arginine concentration and increasing levels of agmatine. The double reciprocal representation shows that all concentration of the inhibitor analysed crossed the y-axis at the same point, which indicates the OcDH is inhibited by agmatine in a competitive manner.

