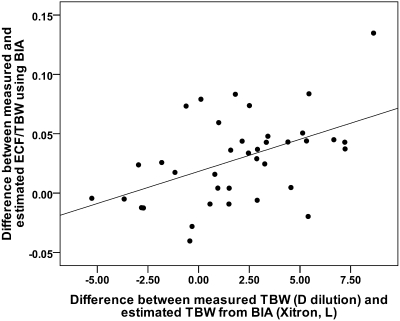
Figure 2.
These two different estimates of overhydration are correlated, (r = 0.48, P = 0.002). The y-axis is a measure of how abnormal the ECW:TBW ratio is, being the difference between the measured value and that predicted from normal subjects, (20), whereas the x-axis is the difference between the estimated and measured TBW (BIA and D dilution, respectively).

