
Figure 1.
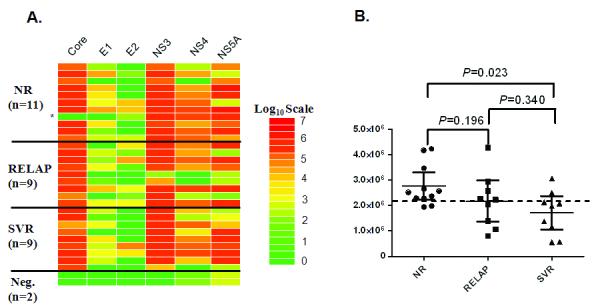
Baseline antibody titers to HCV antigens and p24. A. Heat map representation of patient antibody profiles to the 6 HCV antigens in pretreatment samples from HIV-HCV coinfected patients with differing response to HCV therapy. Antibodies titers were determined in patients from 3 subgroups of HCV-HIV coinfected patients including NR (N=11), RELAP (n=9), SVR (n=9) and 2 non-infected controls. The antibody levels for each serum were log10 transformed and then the levels were color-coded as indicated by the log10 scale on the right, in which signal intensities range from red to green indicating high (red) and low (green) antibody titers. The unusual NR patient without anti-core, anti-E1 and anti-E2 antibodies is shown by the asterisk. B. Anti-p24 antibody titers. Each symbol represents individual samples from NR, RELAP and SVR subgroups. Antibody titers are plotted in LU on the Y-axis and the mean with 95% confidence interval are shown for each group. P values were calculated using the Mann Whitney U test.