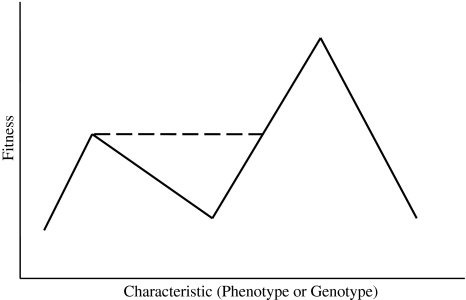
Fig. 1.
How a population crosses from a lower to a higher adaptive peak, over a valley of lower fitness, changing the adaptive landscape with an adaptive bridge. The dashed line indicates that the adaptive bridge is a less direct route in that in it requires more genetic changes in order for the population to take it. Although this is a two-dimensional graph, the adaptive landscape may be visualized as multi-dimensional. This very general graph can represent any adaptive landscape, which could include genetic codes or any other phenotypic or genotypic traits (see text for further explanation)

