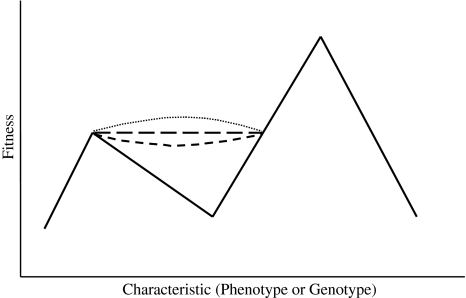
Fig. 2.
Multiple possible routes a population can take in traveling from a lower to a higher adaptive peak. The V-shaped route that descends deep into a valley of lower fitness is solid to indicate it requires the least genetic changes of all the possible routes. Nevertheless, it is the least probable because it requires the population to descend through a valley of much lower fitness, requiring the less fit members of the population to survive better and produce more offspring than the more fit during the descent. The convex curve that descends as it leaves the lower peak is the least probable of the three routes represented by dashed lines for the same reason. How concave or convex the curve happens to be, and thus how far the convex curve descends into the valley of lower fitness before ascending, is not necessarily correlated with the number of genetic changes required to cross the maladaptive valley. There may be many more than four possible routes available to the population. Although this is a two-dimensional graph, the adaptive landscape is best visualized as multi-dimensional. This very general graph can represent any adaptive landscape, which could include genetic codes or any other phenotypic or genotypic traits (see text for further explanation)

