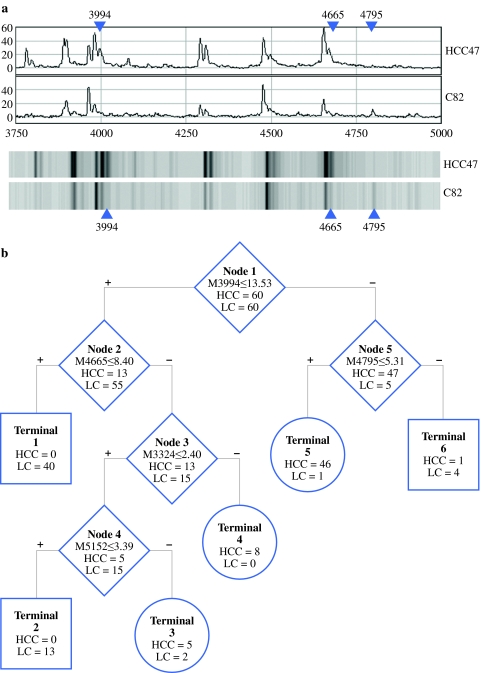
Fig. 1.
a Trace view (above) and gel view (under) of representative SELDI-TOF-MS spectra of serum samples from HCC and cirrhosis patients in the range from m/z 3750 to 5000. The three major discriminative peaks at m/z 3994, 4665, and 4795 in the classification tree are pointed out by arrows, respectively. b The optimal classification tree generated by CART. The binary classification tree composed of 5 classifiers (open diamond node). The decision-making process involves the evaluation of if–then rules of each node from top to bottom, which eventually reaches a terminal with designed class outcome—(dark circle), HCC, or (gray square), LC

