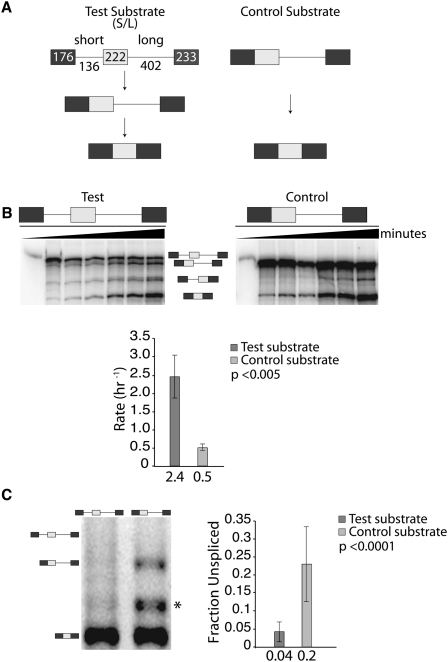
FIGURE 1.
An initial upstream intron removal event increases the efficiency of a downstream intron removal event. (A) Substrates used for analyzing splicing efficiencies. The test substrate (S/L) contains an optimized short upstream intron that is removed quickly and a second, larger intron with delayed removal kinetics. This creates a splicing intermediate containing a long upstream exon and a long intron that is identical in sequence to the control substrate. (B) In vitro analysis showing a 3-h splicing time course. As input control, ∼5% of the starting reaction was loaded on the left lane of each panel. The graph displays the results as the average rate of intron removal based on three biological replicates. The identity of bands detected is indicated between the representative gels. (C) Splicing efficiencies in cell transfection experiments. Representative gel analysis of RT-PCR reactions (left) and combined quantification (right) are shown. The identity of bands detected is indicated on the left side of the representative gel. An asterisk (*) denotes a nonspecific RT-PCR product. The graph represents the average fraction unspliced based on 21 biological replicates. The statistical significance of the differences observed in B and C is defined by the P-value next to each graph.

