FIGURE 3.
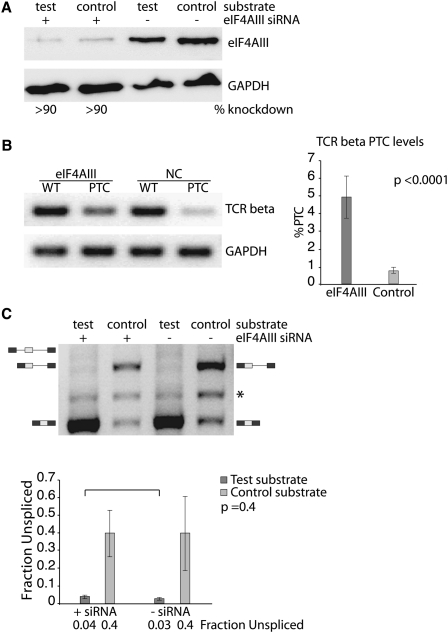
The EJC does not contribute to increased splicing efficiency. (A) Western blot demonstrating eIF4AIII knockdown in HeLa cells. (B) RT-PCR analysis of TCR beta mRNA expression measuring NMD activity. TCR beta mRNA products are compared with GAPDH levels for each sample. The graph on the right shows the quantification of eight independent real-time PCR experiments. The statistical significance of the differences observed is defined by the P-value next to the graph. (C) Splicing efficiencies of S/L test substrates in cell transfection experiments with eIF4AIII protein knockdown. A representative gel shows the results of RT-PCR amplified spliced products (top). The identity of bands detected is indicated on the sides of the representative gel. The asterisk (*) denotes a nonspecific PCR amplification product. The results from three independent experiments are displayed in the graph below as the average fraction unspliced. The statistical significance of the differences observed between siRNA treated and control treated experiments is defined by the P-value next to the graph.

