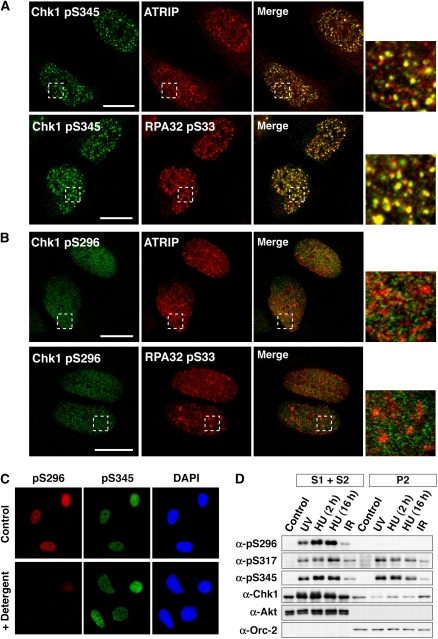
Figure 2.
Spatial distributions of phosphorylated Chk1. (A, B) UV-irradiated HeLa cells were stained with the indicated antibodies. Scale bars are 10 μm. (C) UV-irradiated HeLa cells were briefly extracted with Triton X-100 detergent and then stained with the indicated antibodies. (D) HeLa cells exposed to UV light or ionizing radiation (IR) or cells treated with hydroxyurea (HU; 2 or 16 h) were fractioned into soluble (S1+S2) and chromatin (P2) fractions. Akt and Orc-2 were used as markers for soluble and chromatin fractions, respectively.

