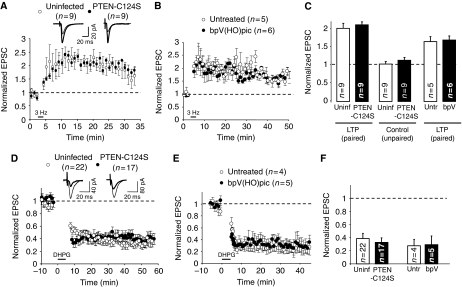
Figure 7.
PTEN activity is not required for LTP or for mGluR-dependent LTD. (A) LTP was induced in CA1 hippocampal neurons expressing GFP-PTEN-C124S (black symbols) or in control (uninfected) neurons (white symbols). Amplitude of the synaptic response is normalized to a 2 min baseline. Inset: sample traces averaged from the baseline (thin lines) or from the last 10 min of the recording (thick lines). (B) Similar to (A), using slices pretreated with the PTEN inhibitor bpV(HO)pic or control (untreated) slices. (C) Average of AMPAR-mediated responses collected from the last 10 min of the recording (25–35 min in (A), 40–50 min in (B)) and normalized to the baseline. Left and right columns (LTP, paired) correspond to the stimulation pathway in which postsynaptic depolarization (0 mV) was paired to presynaptic stimulation (3 Hz). Middle columns (control, unpaired) correspond to the pathway that was not stimulated during depolarization; ‘n' represents number of cells. (D) mGluR-dependent LTD was induced by bath application of 50 μM DHPG (agonist of type I mGluR receptors). Recordings were carried out in the presence of 100 μM AP5 (NMDAR antagonist) (see Materials and methods). Synaptic responses were normalized to a 10 min baseline before DHPG application for uninfected neurons (white symbols) and for GFP-PTEN-C124S-expressing neurons (black symbols). Inset: sample traces averaged from the baseline (thin lines) or from the last 10 min of the recording (thick lines). (E) Similar to (D), using slices pretreated with the PTEN inhibitor bpV(HO)pic or control (untreated) slices. (F) Average of AMPAR-mediated responses collected from the last 10 min of the recording (50–60 min in (D), 35–45 in (E)) and normalized to the baseline.

