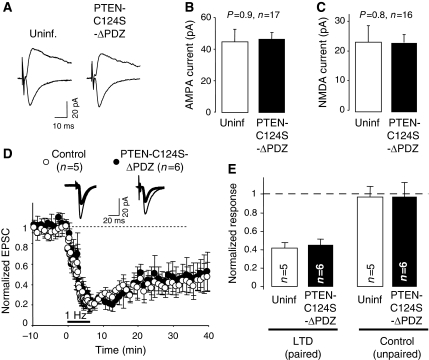
Figure 8.
Involvement of the PDZ motif of PTEN in LTD. (A) Sample traces of evoked AMPAR- and NMDAR-mediated synaptic responses recorded at −60 or +40 mV, respectively, from CA1 neurons expressing GFP-PTEN-C124S-ΔPDZ and neighbouring control (uninfected) neurons. (B) Average AMPAR-mediated current amplitude (peak of the synaptic response recorded at −60 mV) from pairs of uninfected and GFP-PTEN-C124S-ΔPDZ-expressing neurons. For (B) and (C), ‘n' represents number of pairs of cells, and statistical significance was determined with the Wilcoxon's test. (C) Average NMDAR-mediated current amplitude (recorded at +40 mV and measured at a latency of 60 ms) from pairs of uninfected and GFP-PTEN-C124S-ΔPDZ-expressing neurons. (D) LTD was induced in CA1 hippocampal neurons expressing GFP-PTEN-C124S-ΔPDZ (black symbols) or in control (uninfected) neurons (white symbols). Amplitude of the synaptic responses is normalized to a 10 min baseline. Insets: sample traces averaged from the baseline (thin lines) or from the last 10 min of the recording (thick lines). (E) Average of AMPAR-mediated responses collected from the last 10 min of the recording and normalized to the baseline. Left columns (LTD, paired) correspond to the stimulation pathway in which postsynaptic depolarization (−40 mV) was paired to low-frequency stimulation (1 Hz). Right columns (control, unpaired) correspond to the pathway that was not stimulated during depolarization; ‘n' represents number of cells.

