
Figure 2.
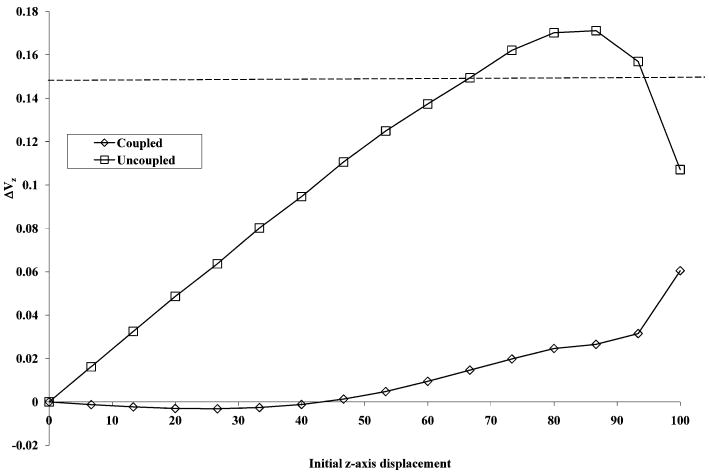
SIMION modeling data of velocity increase as a function of initial z-axis displacement. The dashed horizontal line represents the onset of the observation of z-axis ejection in this model.
Official websites use .gov
A
.gov website belongs to an official
government organization in the United States.
Secure .gov websites use HTTPS
A lock (
) or https:// means you've safely
connected to the .gov website. Share sensitive
information only on official, secure websites.
SIMION modeling data of velocity increase as a function of initial z-axis displacement. The dashed horizontal line represents the onset of the observation of z-axis ejection in this model.