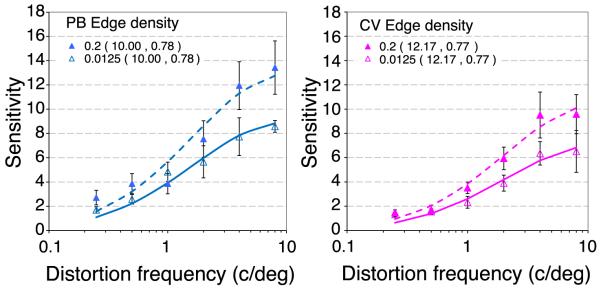
Figure 9.
Distortion MTFs at low or high local edge densities for two observers (PB, blue, and CV, pink). Spatial distortions were centered on regions of low (0.0125 edges per pixel, filled squares) or high (0.2 edges per pixel, open circles) local edge density. The rms contrast was 0.5 and the images were centered 2.8° from fixation in a 4AFC paradigm (Figure 8). Error bars show 95% confidence intervals. The curves show the best fitting log Gaussian with the parameters (mean, standard deviation) shown in the caption.

