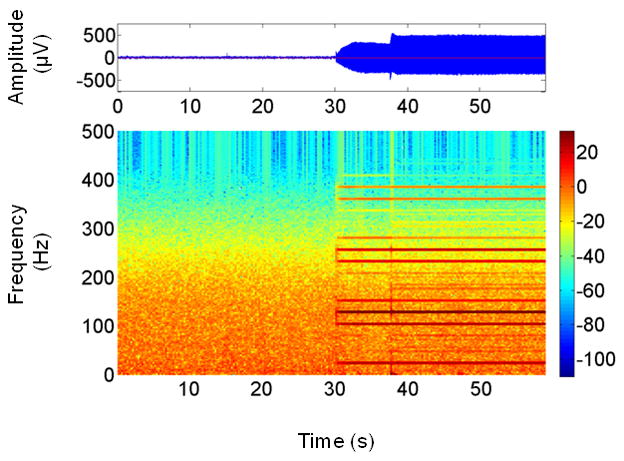
Figure 1.

EEG time series (top) showing the increase in signal amplitude at 30 s when the pulse generator for DBS stimulator was turned on. The time-frequency map of this signal (bottom) reveals that the artifact comprises multiple narrowband signals spaced at regular intervals. Note the transient changes in both amplitude and frequency content of the artifact over the first ~10 s of unilateral stimulation, after which the artifact’s amplitude is constant and can be considered stationary.
